High-frequency cable engineering

From a raw measurement to a link that has not been built yet.

Seven engineering packages that take an automotive Ethernet cable all the way through: measure it, prove the measurement can be trusted, understand what the factory did to it, compare laboratories across three countries, and predict whether a harness will pass the standard months before the first sample exists.

7 / 7 demonstrations verified end-to-end
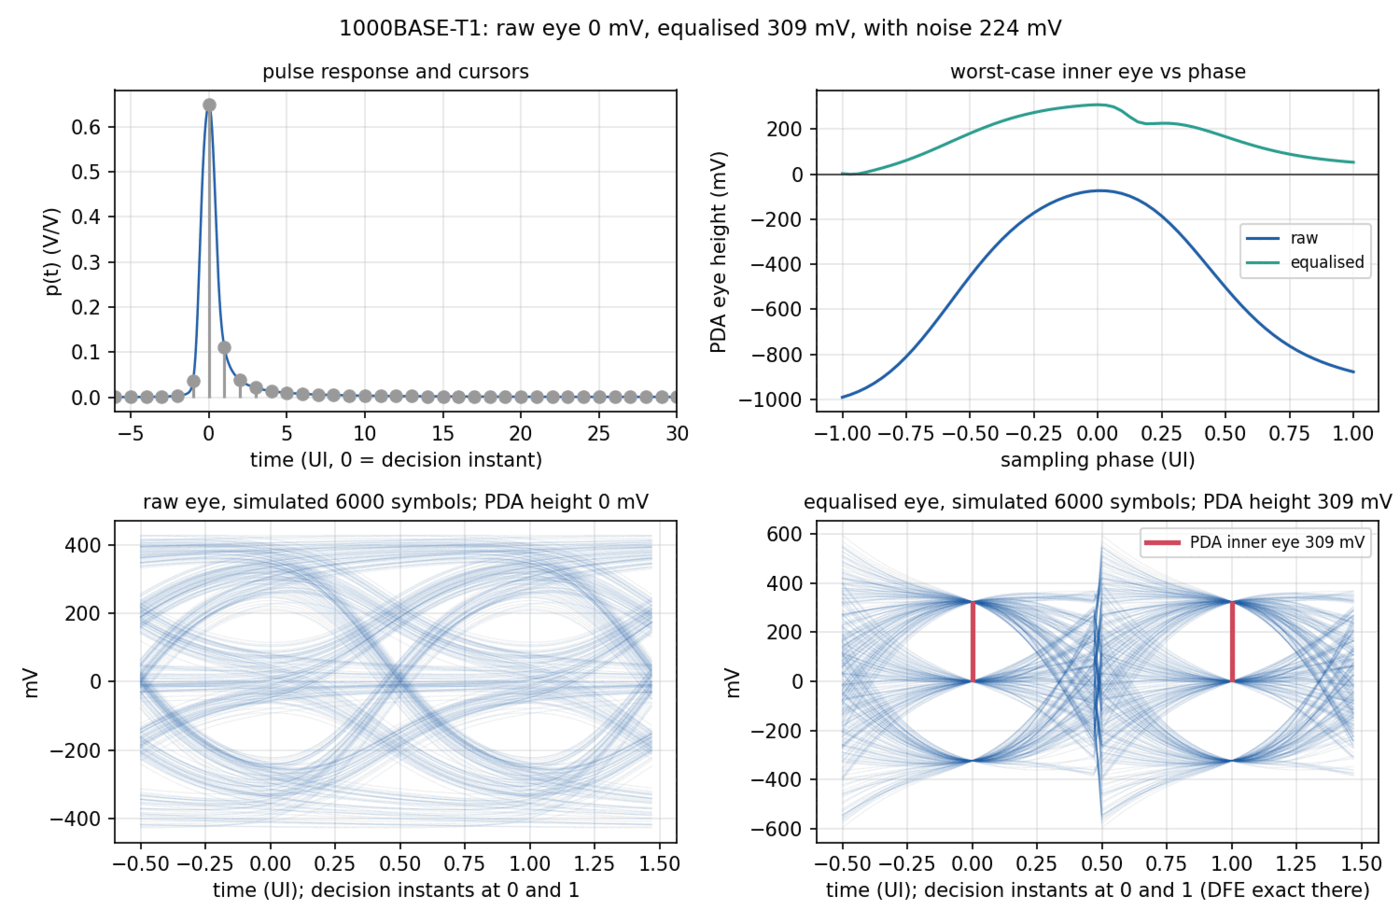
linktwin eye examples/camera-link.toml
Four panels: the pulse response with its sampled cursors, worst-case eye height against sampling phase, and the simulated raw and equalised eye diagrams for a 1000BASE-T1 link.
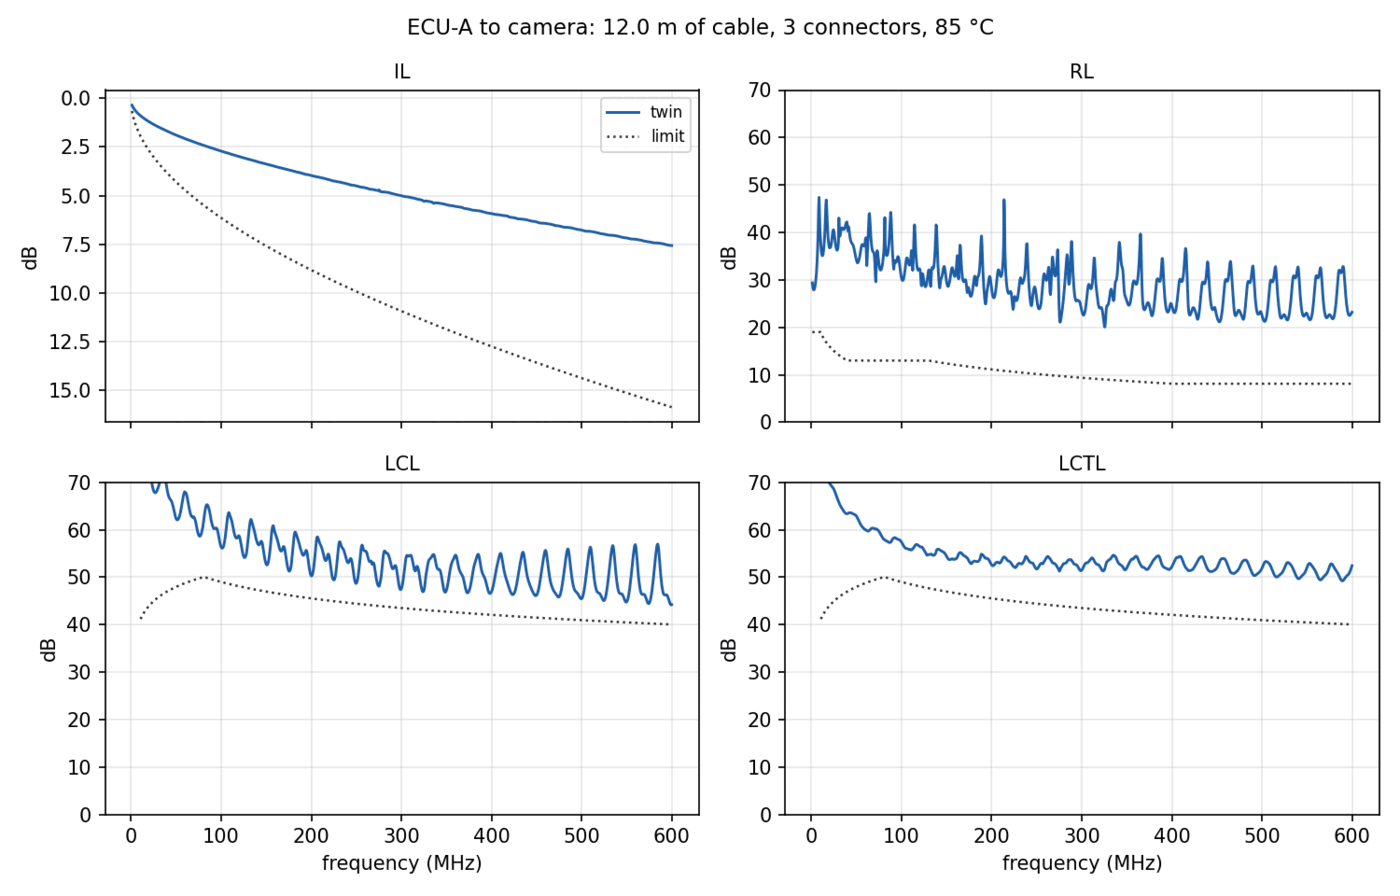
The predicted eye at the receiver of a 12 m harness at 85 °C. Closed without equalisation, 309 mV open with it — computed before the harness exists.
7
Packages
16.6k
Lines of code
143
Tests in CI
90
Report pages
152
References cited
10
Repositories
The toolchain — code, tests and documentation
4
Laboratories
200
Measurement jobs
3,610
Results
40
Calibrations
48
Verifications
10
Round-robin rounds
The simulated network it runs — every number generated by the code above, traceable to a sealed archive · all measurement data is synthetic, by design
Architecture

One pipeline, seven independent packages

Every package stands alone and is installable on its own, but each one consumes what the previous ones produce. The arrows are real dependencies, not a diagram drawn after the fact.

Every box is a page — click any package for the full engineering case study.

The toolchain

Seven projects, A through G

Each is a working package with its own test suite, command-line interface and technical report stating the mathematics it implements and the limits of what it can claim. Every card opens a full case study — and one page follows a single sample through all seven.

A

cablecheck

Measurement to engineering verdict
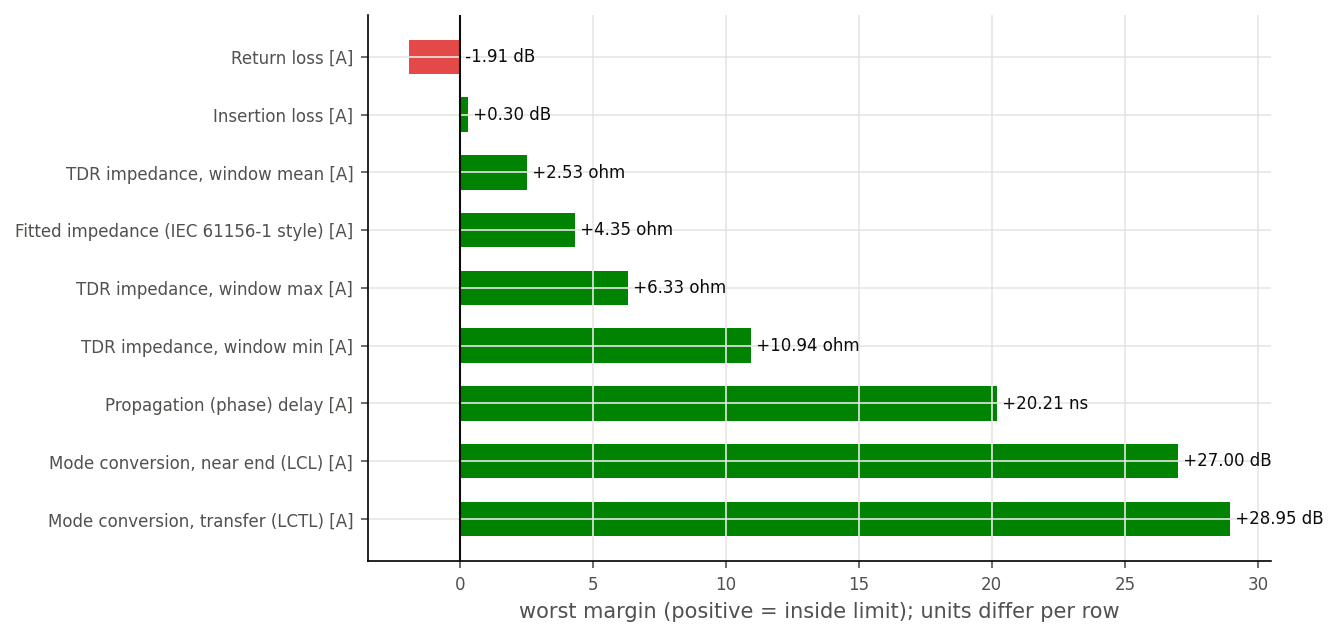
Removes the fixture, converts raw four-port data into the quantities engineers specify, and issues a verdict against the standard with the margin and the frequency where it was worst.

TakesTouchstone / VNA CSV, fixture description
Producesverdict · margins · IL RL LCL NEXT FEXT delay NVP Z(x) · report · database row
B

labauto

The laboratory as a programmable system

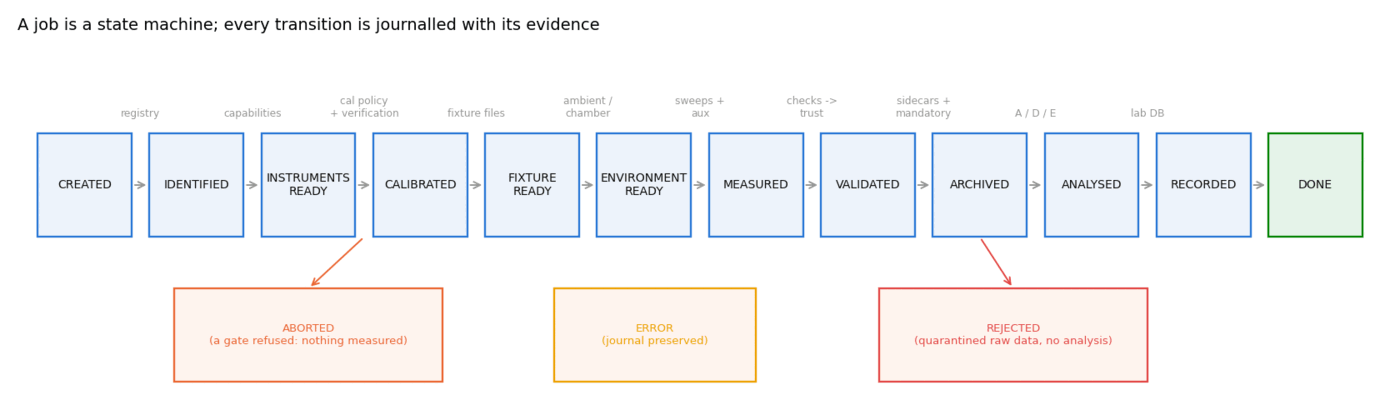
Knows what measurement is being performed, what a valid calibration is, which checks must pass, and whether a result is trustworthy enough to enter the database at all.

Takesbarcode · procedure · instruments (real or simulated)
Producessealed hashed archive · trust decision · database, refusals included
C

shieldeval

Legacy algorithm reconstruction

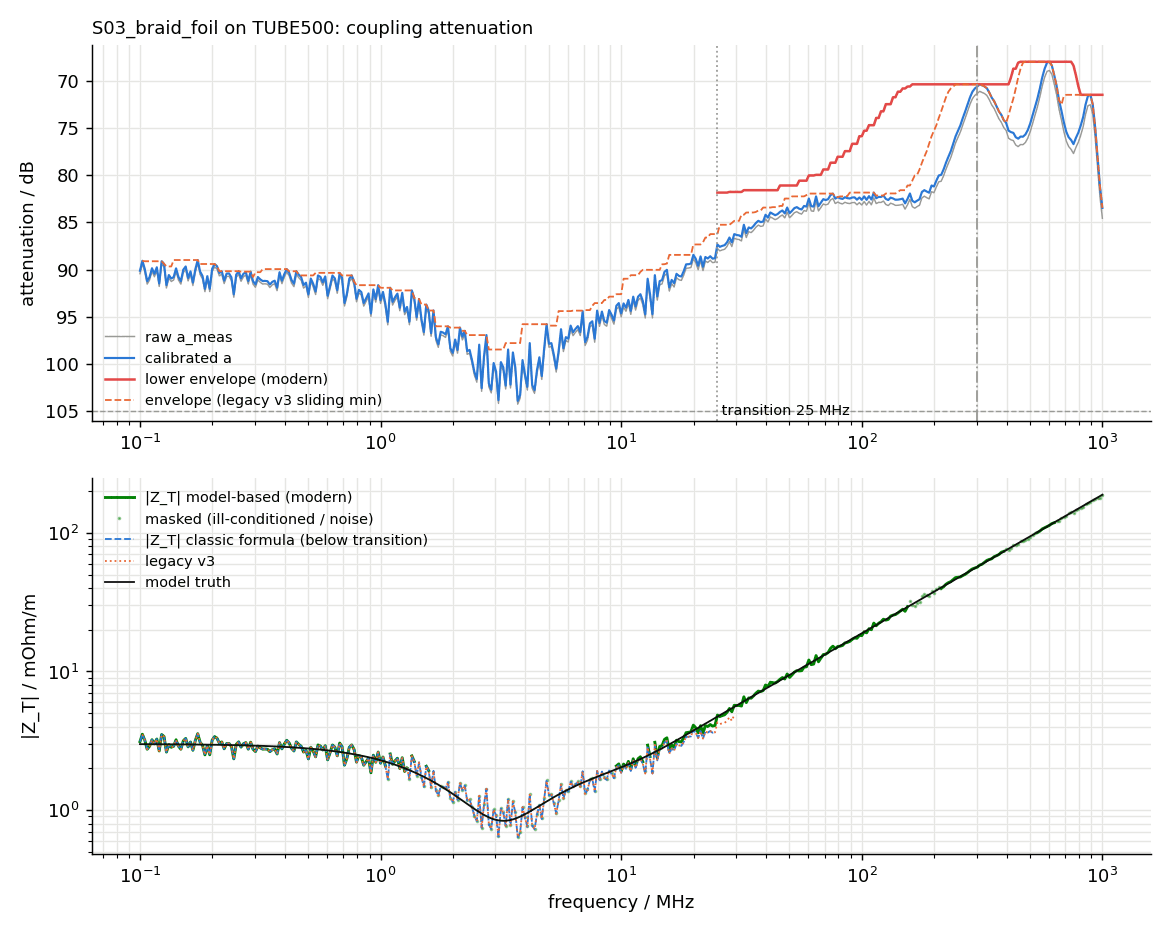
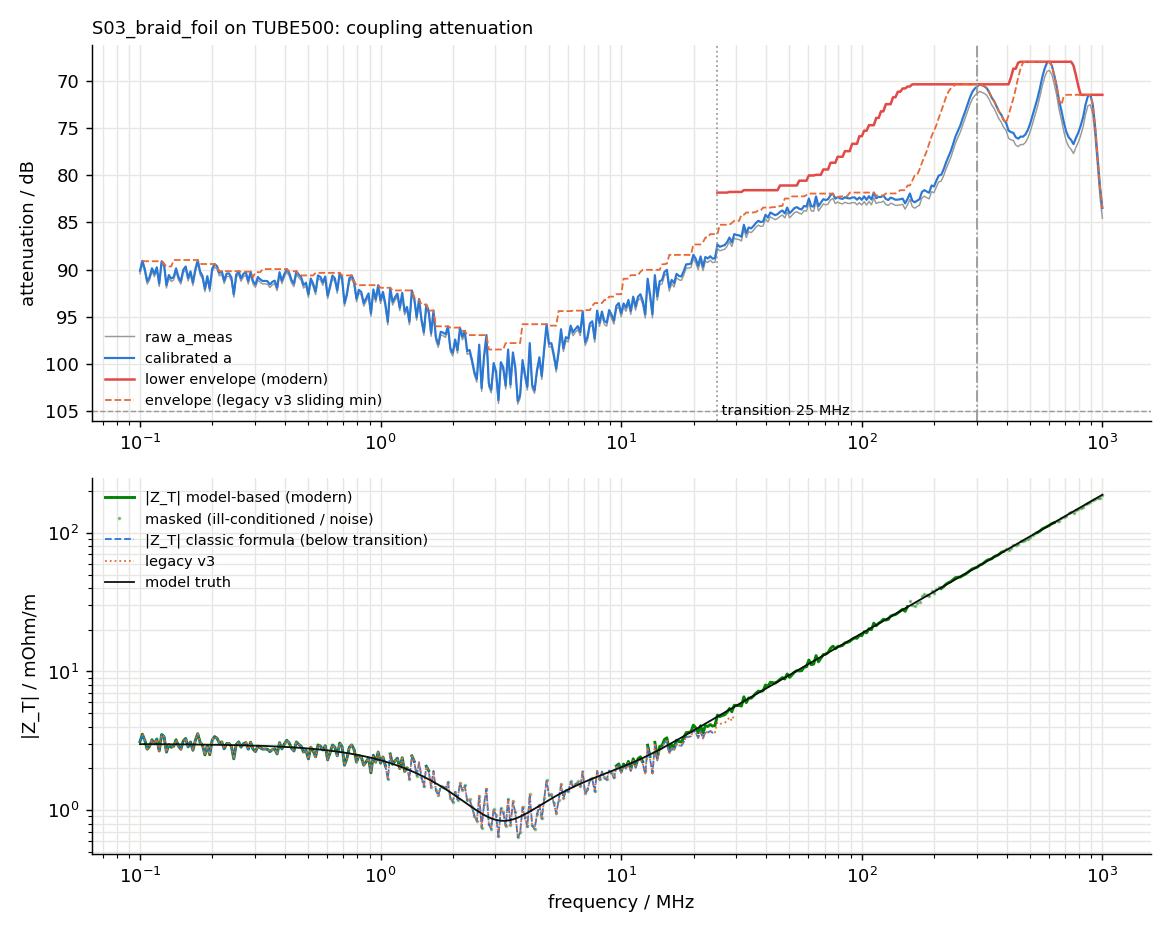
Reproduces a legacy-style shielding tool exactly so old results stay reproducible, implements the modern method beside it, and quantifies the cost of migrating.

Takesarchived raw triaxial / line-injection files
ProducesZ_T and a_S by legacy and modern method · quantified difference
D

zprofile

Impedance profile reconstruction

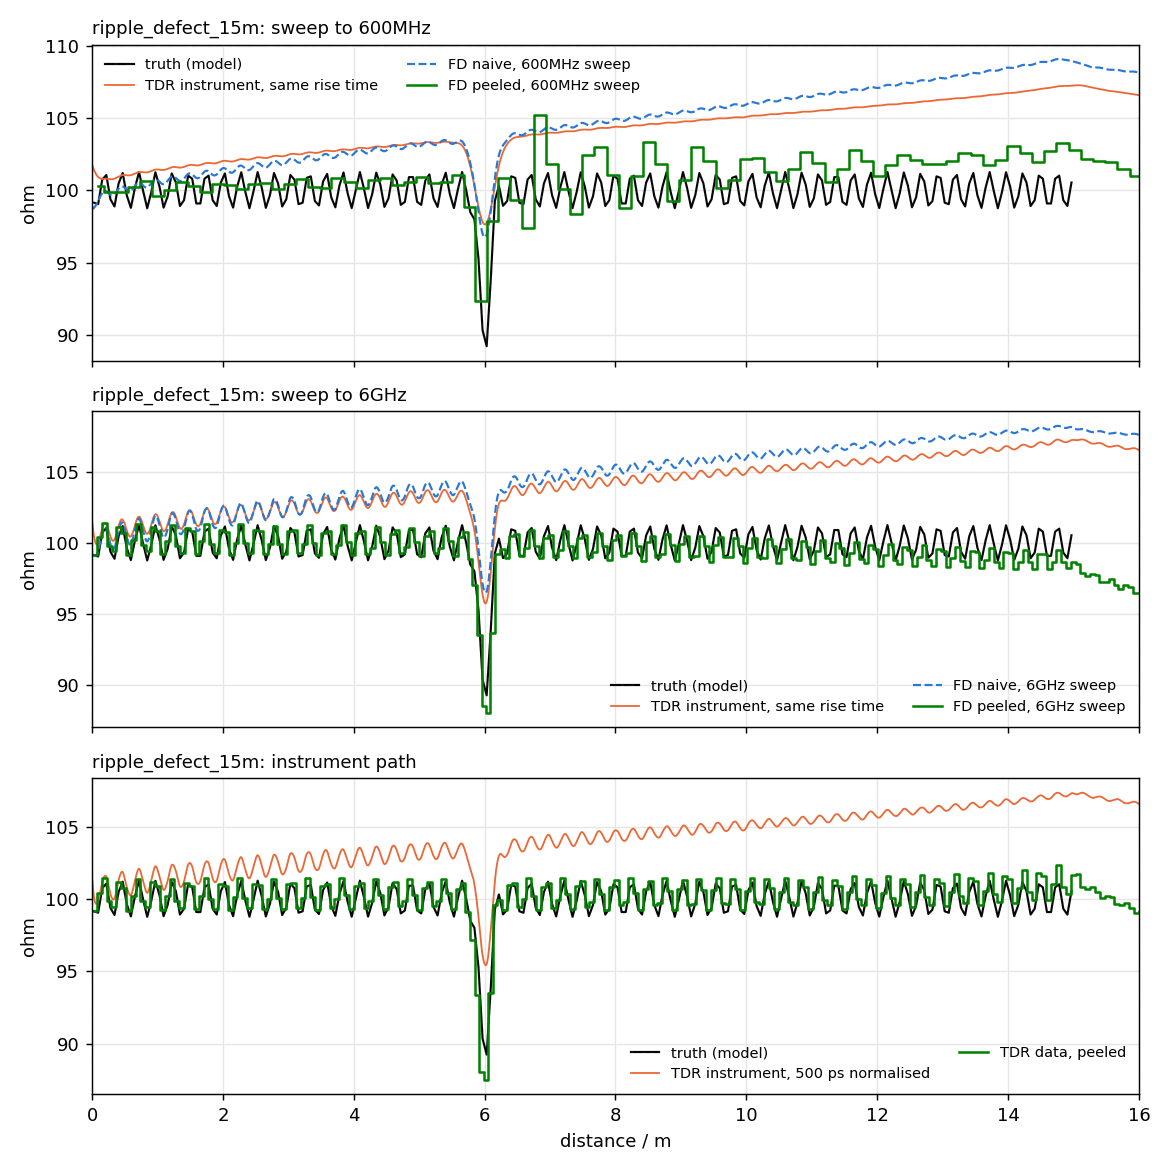
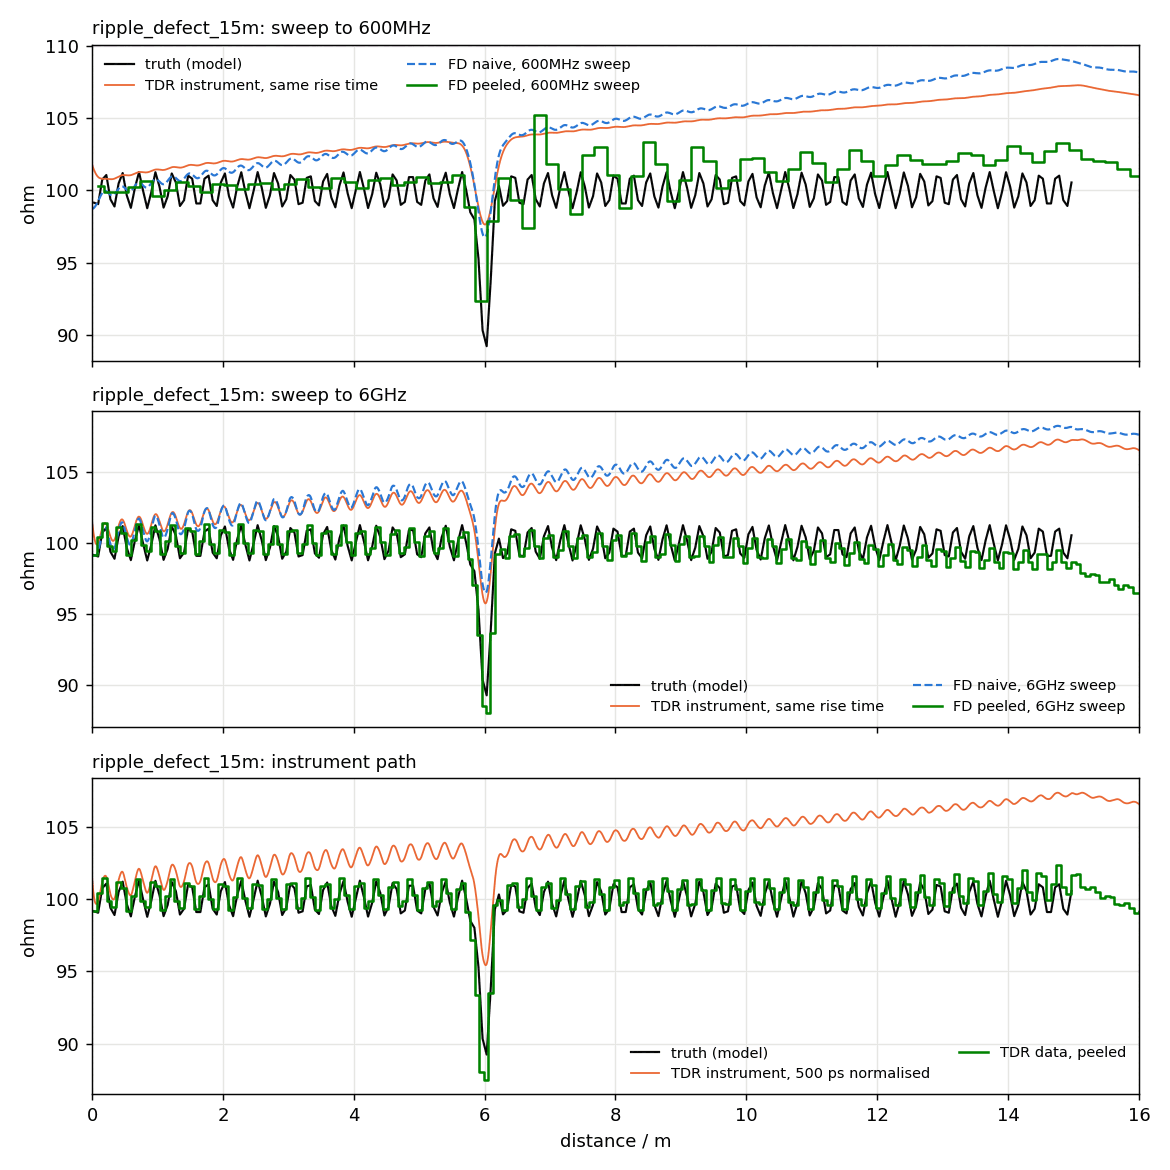
Turns a frequency-domain reflection into characteristic impedance metre by metre, so a defect becomes a position rather than a bump on a graph.

TakesS_dd11(f), S_dd21(f), length
ProducesZ(x) metre by metre · ripple · defect position · sensitivity budget
E

cableanalytics

Production to physics correlation

Correlates extrusion-line parameters against measured high-frequency behaviour, and predicts loss and impedance from a production record alone.

Takesextrusion records · gauge logs · measured losses
Producespredicted a, b, Z with 90 % intervals · derating · ripple attribution
F

labplatform

Multi-site metrology platform

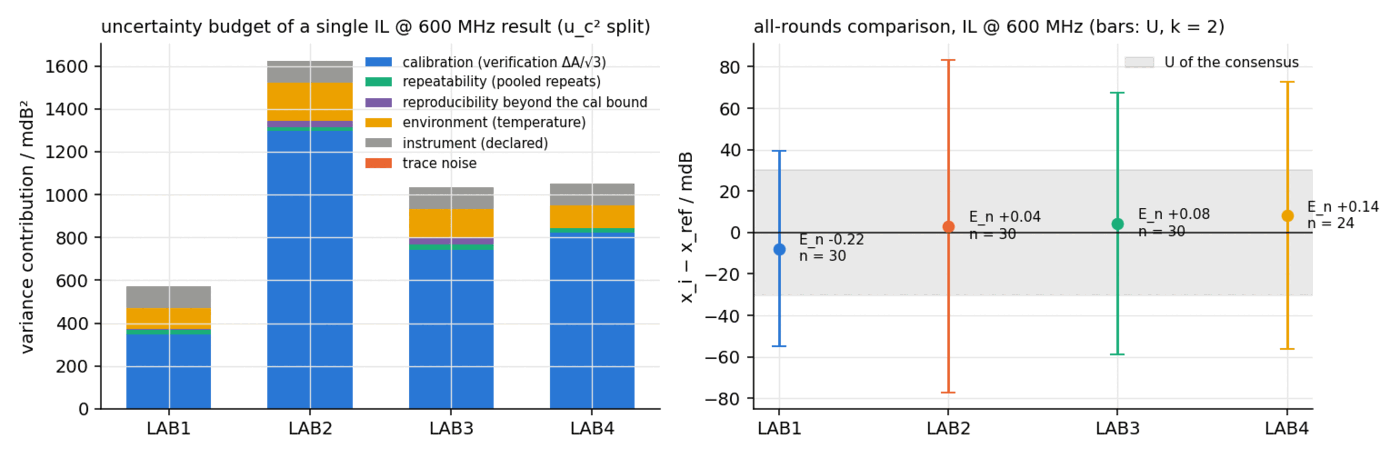
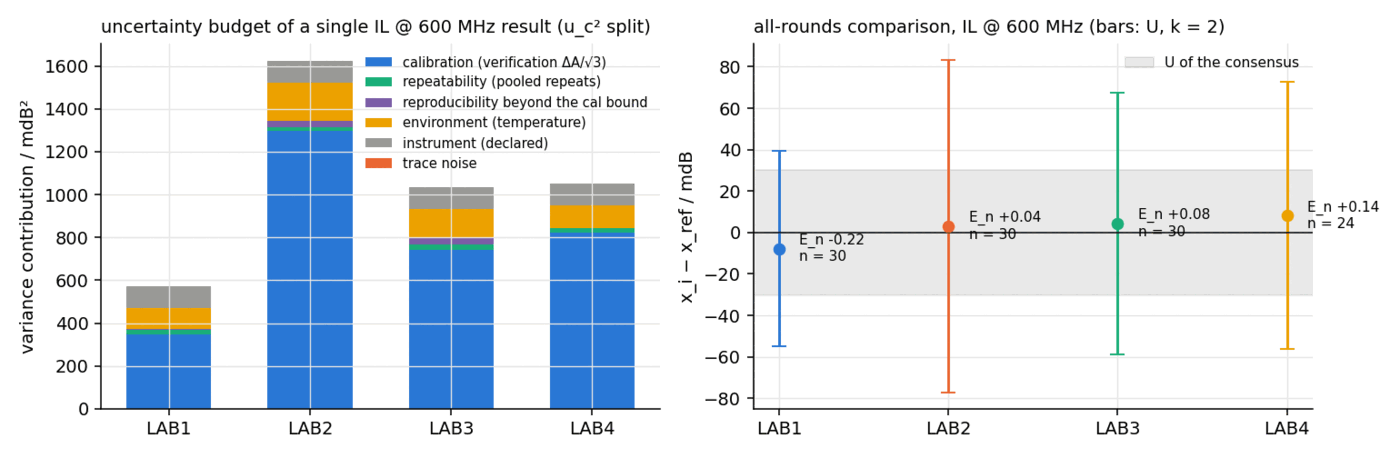
Gives every result a full uncertainty budget, so a 0.8 dB disagreement against 1.2 dB of uncertainty is reported as not distinguishable rather than as a fault.

Takessealed archives from every site
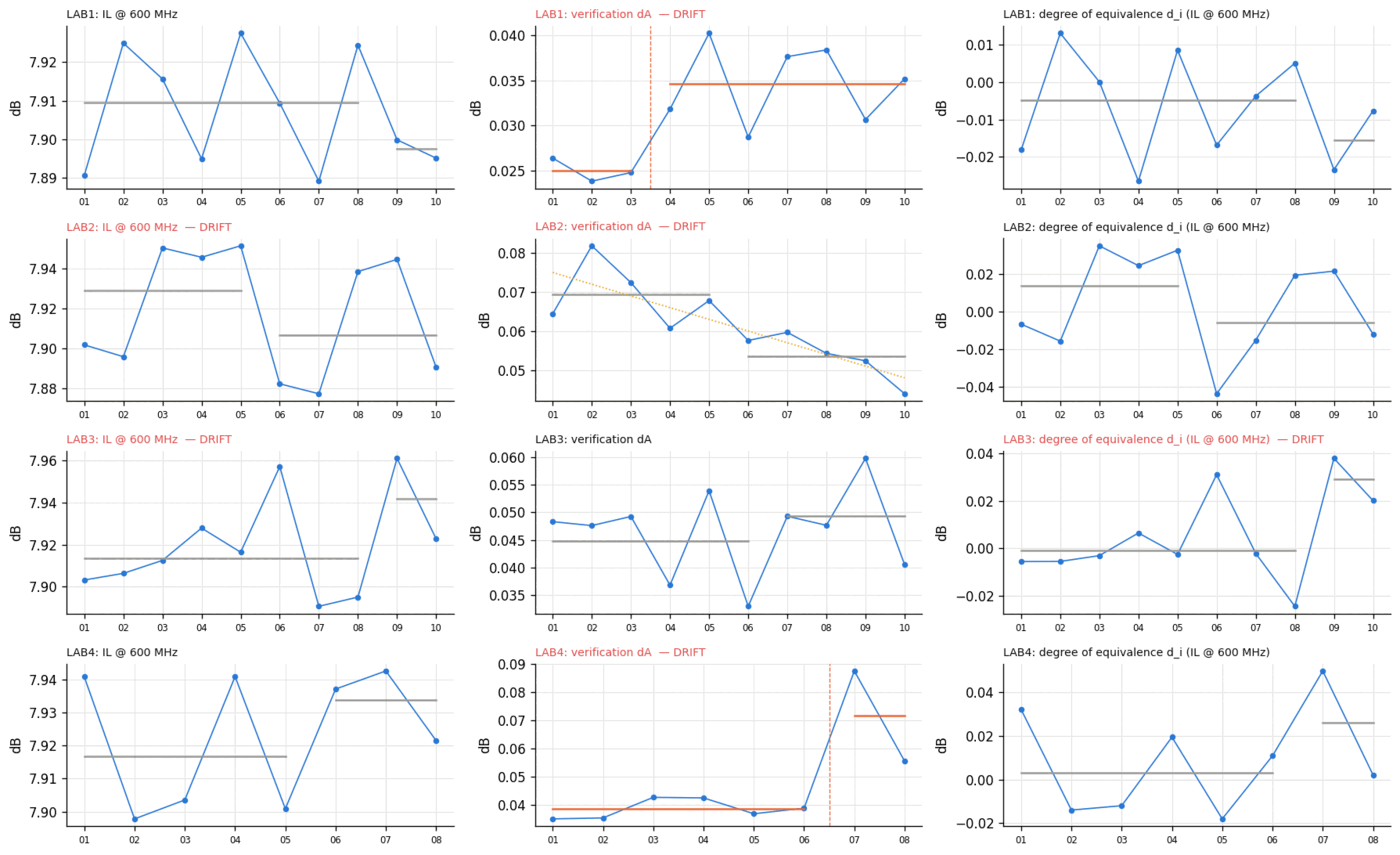
Producesuncertainty budgets · E_n · R&R · drift alerts · trust cards
G

linktwin

Predictive digital twin
Capstone

Assembles a virtual link from measured, archived or predicted cable data and answers whether it passes, how far it reaches and what the receiver sees.

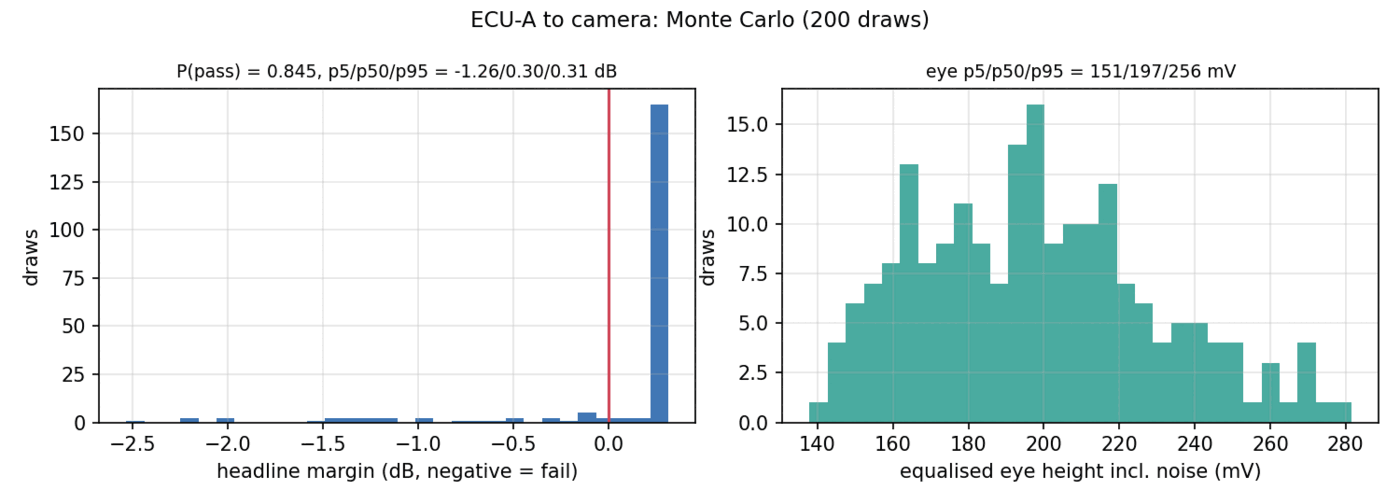
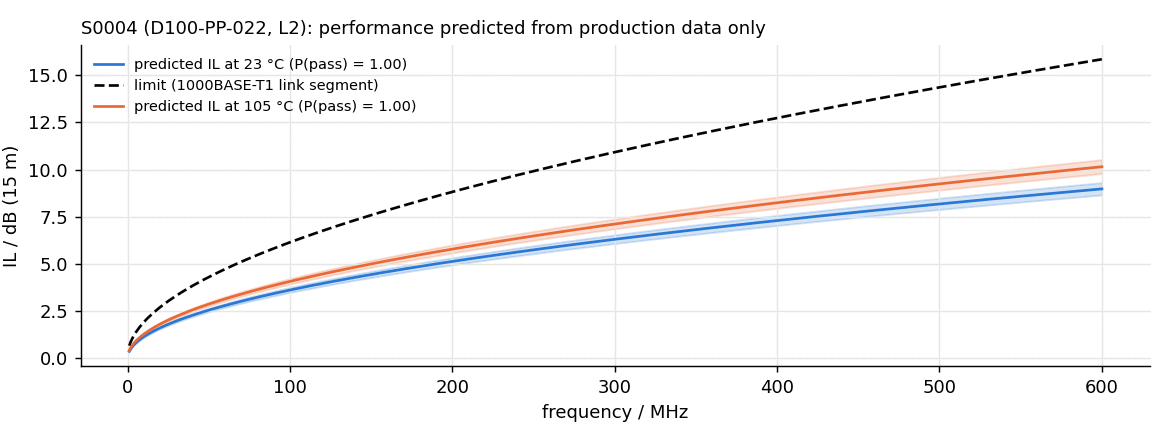
From a single noisy 10 m measurement it predicts 3 to 25 m at 23 to 125 °C to within 0.1 dB, extrapolates an octave past the band to within 0.04 dB, and its worst-case eye is a tight lower bound on a bit-level simulation — 420 against 421 mV.

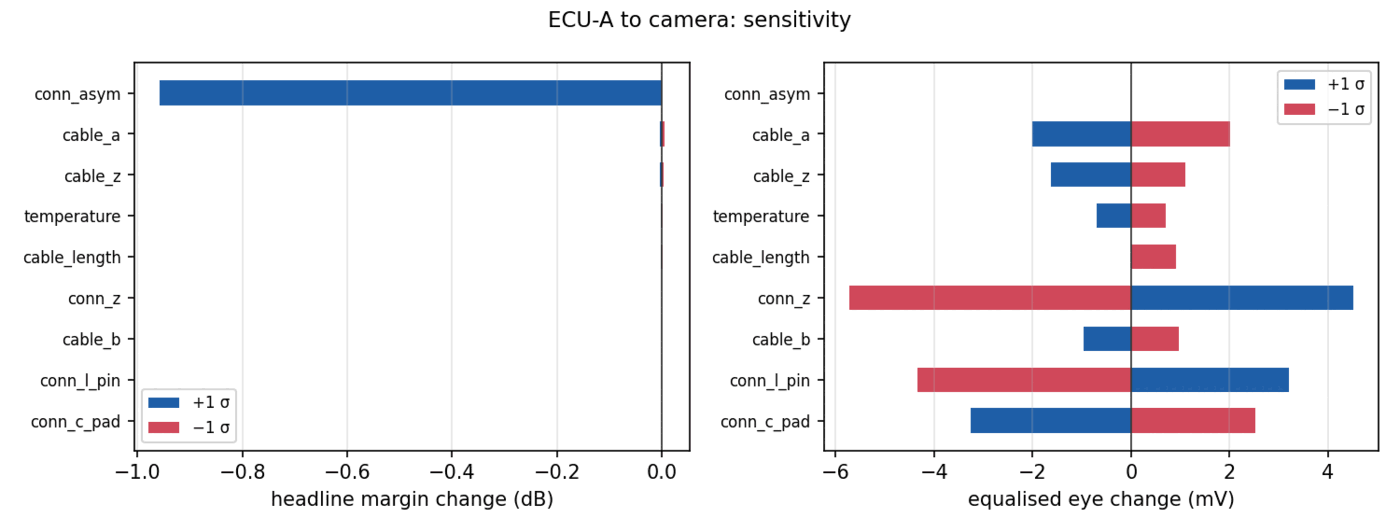
Monte Carlo distributions of the link margin and the equalised eye height over 200 draws of the tolerances.
Multi-site metrology

Four laboratories, three countries, one reference

When several sites measure the same product, the question is not what each one measured but whether they agree — and how you would know. Every result carries a full uncertainty budget, so a difference is only called a problem when it is larger than the uncertainty of that difference.

Roth1Kitzingen2Jelenia Góra3Changzhou4
1
Roth, Germany
Reference laboratory · 7.9071 ± 0.047 dB
En -0.22 compatible
2
Kitzingen, Germany
Measurement site · 7.9180 ± 0.080 dB
En +0.04 compatible
3
Jelenia Góra, Poland
Measurement site · 7.9193 ± 0.063 dB
En +0.08 compatible
4
Changzhou, China
Measurement site · 7.9231 ± 0.065 dB
En +0.14 compatible

Insertion loss at 600 MHz on the circulating artefact, aggregated over ten fortnightly rounds. The reference is a Cox largest-consistent-subset consensus of 7.9149 dB. En is the difference from that reference divided by the expanded uncertainty of the difference: any value below 1 means the sites are not distinguishable. Site symbols are displaced where two sites coincide at map scale.

200measurement jobs — each mark is one, from the network's own records
Roth
Kitzingen
Jelenia Góra
Changzhou
sample passed its limits measured fine, sample failed — a product result, not a laboratory error refused at the calibration gate — the degraded site, caught
Output

What the toolchain actually produces

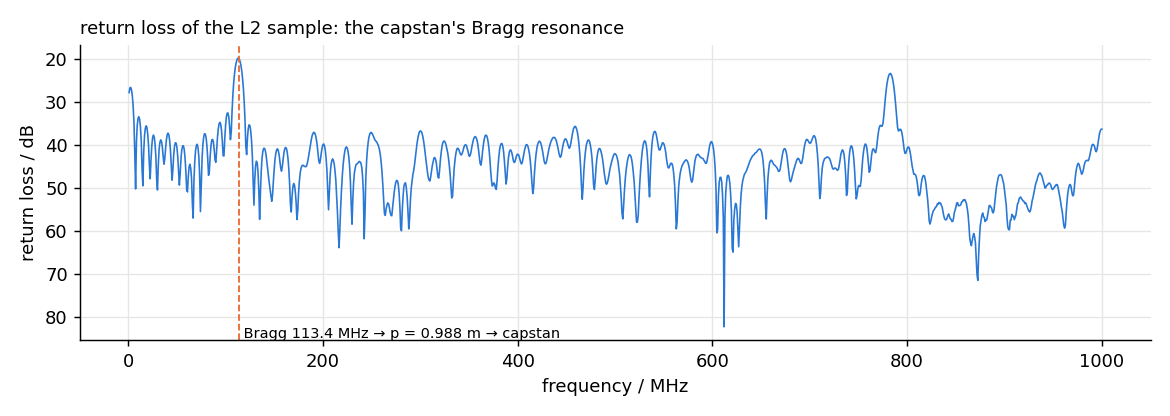
Every image below is generated by running the code in this repository — no mock-ups, no illustrations. Each figure is reproducible from a single command.

Build order

Built in four phases, bottom up

Nothing here could have been built in a different order. Each phase needed the one before it to exist first — the digital twin is only possible because the measurement layer underneath it is trustworthy.

Phase 01

Foundation and core algorithms

The measurement layer: network algebra, de-embedding, mixed-mode decomposition and limit evaluation, plus the two standalone algorithm projects.

cablecheckzprofileshieldeval
Phase 02

Production analytics

Linking what happens on the extrusion line to what the laboratory measures, and turning that link into a predictive model with stated intervals.

cableanalytics
Phase 03

Automation and the trust layer

Making measurements reproducible six months later from the archive alone, then making several laboratories comparable to each other.

labautolabplatform
Phase 04

Predictive digital twin

Using every layer below to answer design questions — pass or fail, reach, connector budget, eye height — before any hardware is built.

linktwin
Documentation

Ninety pages, every method stated

Each package ships a technical report that gives the mathematics with notation defined where it is used, cites the standards and papers it rests on, reports the validation against ground truth, and ends with a section declaring what the method does not model. The reports are built from source in continuous integration, so they cannot drift from the code.

About this work

Engineering portfolio, production standards

I am Sreeram Anil, an MSc Electromobility student at FAU Erlangen-Nürnberg, writing my thesis on model-predictive control, based in Bavaria. This toolchain is a portfolio project: it was built to find out whether an entire measurement-to-prediction chain for high-frequency cables could be made to hold together, and to build it the way it would have to be built in industry.

Every package has a test suite that runs on three Python versions on every push, a technical report built from source, an uncertainty statement where one is warranted, and a declared list of its own limitations. The engineering judgement — what to model, what to measure, what to validate against, and what to refuse to claim — is the substance of the work.

Jacketthe 150 °C rating lives here Braid shieldshieldeval's subject Foil Dielectrictan δ → the b·f loss term Copper pair, 100 Ω differentialskin effect → the a√f loss term The object of study — every loss term in the models maps to a layer of this drawing.

All data here is synthetic

No proprietary or customer measurements appear anywhere in this toolchain. Cables come from a physics-based synthesiser, instruments from a simulator with a realistic error model, and production records from a generator. That is a deliberate choice, and it is what makes the validation meaningful: the ground truth is known exactly, so every claim about accuracy is checked against a number rather than asserted.

Built with AI assistance

The commit history records it openly. The architecture, the validation strategy, the decisions about what each method may and may not claim, and the limitations stated in every report are the engineering content — and they are what I can walk you through line by line.